
Fostering the right solutions & connections
for more than 33 years
for more than 33 years

4Q19 NIC MAP Market Fundamentals data has been released and is now available. Download a snapshot of fourth quarter, 2019 data, which includes occupancy rates, annual rent growth, annual inventory growth, key findings and more. |
 |
Wide variation among regional markets, while assisted living occupancy rate strongest in two years
ANNAPOLIS, MD. (January 9, 2020)—Senior housing occupancy increased 0.1 percent in the fourth quarter of 2019 to 88.0 percent, according to new data from the National Investment Center for Seniors Housing & Care (NIC). San Jose (95.7%) and New York (91.3%) experienced the highest occupancy rates of the 31 metropolitan markets that comprise NIC’s Primary Markets. Atlanta (82.7%) and Houston (82.5%) recorded the lowest. Las Vegas experienced the largest occupancy increase from a year ago, rising from 80.3 percent to 84.1 percent. Cincinnati saw the largest year-over-year decrease, falling from 89.7 percent to 86.4 percent.
In a breakout of senior housing types, assisted living occupancy increased to 85.7 percent in the fourth quarter, from a recent record low of 85.1 percent earlier in the year as demand outpaced new inventory growth. The occupancy rate for independent living decreased to 90.0 percent in the fourth quarter, below its recent peak of 90.4 percent in the first quarter of 2019 and down from 90.3 percent one year earlier.
“It appears that 2019 was an inflection year for assisted living with the occupancy rate at its highest level in two years after having reached its trough and new construction continuing to slow,” said Chuck Harry, head of research and analytics at NIC.
For the year, net absorption totaled 15,643 units for senior housing, the most units demanded on a net basis for a full year since NIC began reporting the data in 2006. Inventory growth decelerated from 21,479 units in 2018 to 16,750 units in 2019 but was nevertheless stronger than net demand.
“Demand was strong, but simply not strong enough to offset the growth in inventory,” said Beth Burnham Mace, NIC’s chief economist. “The slowdown in starts and in the number of units under construction suggest an improving outlook for senior housing, especially for assisted living.”
NIC’s Primary Markets saw 17,718 new construction starts in the last four quarters, the fewest new starts since 2014. These construction starts amounted to 2.8 percent of total existing senior housing inventory, down from 3.8 percent a year ago and 4.6 percent in early 2018.
NIC data also reveal that continuing care retirement communities (CCRCs), which offer multiple types of care by a single provider on one campus, reported higher occupancy rates than non-CCRC properties in the fourth quarter of 2019 (91.2% vs. 86.3%). Part of the explanation can be traced to lower inventory growth for CCRCs than for non-CCRC properties, NIC experts say.
To learn more about NIC quarterly senior housing and skilled nursing data, please visit NIC.org.
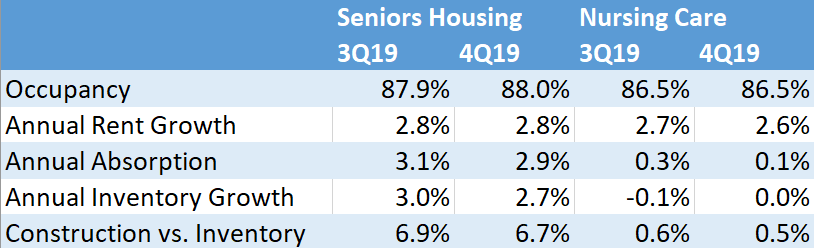
A summary of the NIC MAP Data Market Fundamentals for 4Q19 is below.
CURRENT ISSUE
State of MD-DC-VACURRENT ISSUE
PA-NJ-DE.jpg)

.png)